You can learn everything about trading. This is the seventh chapter of the Beginner Course, we are going to talk about the basic knowledge of Chart.
In this chapter, you will learn about:
- Basic knowledge about Chart
- Charting Basic Concept
- Types of Chart
INTRODUCTION TO THE CHARTING BASICS
Charts are Forex traders’ best friends. As a Forex trader, you will most likely utilize your price charts more than any other available tool.
Since chart are going to play such a large part in trading, it is imperative traders become familiar and be comfortable with charts.
Charting Basics Concept, as follows:
Traders have the flexibility to choose which time frame is the best.
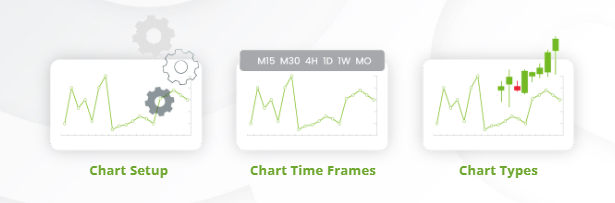
CHART SETUP
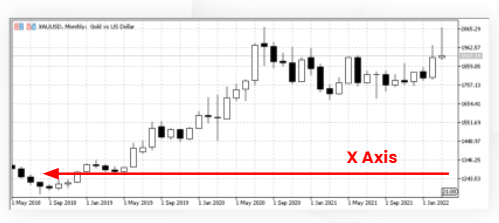
The X axis
Runs horizontally along the bottom of the chart providing a timeline for everything that has happened on the chart. The most recent price action is shown on the right side of the chart and the most distant price action is shown on the left side of the chart.
The Y axis
Runs vertically along the right side of the chart providing a price scale for the price movement on the chart. Lower prices are shown toward the bottom of the chart and higher prices are shown toward the top of the chart.
When traders put the two axes together, you can see at what price a currency pair was trading at a particular time in the past.
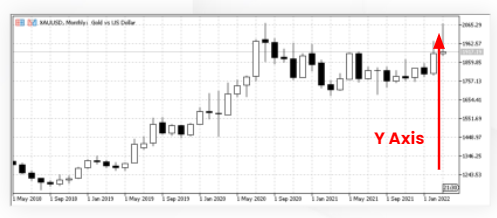
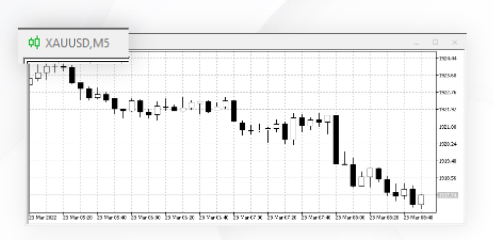
CHART TIME FRAMES
Charts give the ability to analyse the price
movement of traders favourite currency
pair anywhere from a minute-by-minute
basis to a month-by-month basis.

If you are a shorter-term trader, you will want to use shorter time frames for your charts. You would most likely want to be watching a 1-minute or a 5-minute chart.
If you are a longer-term trader, you will want to use longer time frames for your charts and watch an hourly or a daily chart.
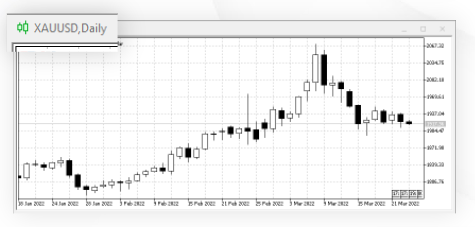
CHART TYPES
Charts give you the ability to analyze the
the price movement of your favorite
currency pair in various formats, from
line charts to candlestick charts.
Technical analysis is a visual, skill that
traders develop, and different traders like
to practice their art on different types of
charts. Some traders feel they can see
and analyze support and resistance levels
better on a line chart, while other traders
feel they get more information on price
movement on a bar chart or a candlestick
chart.

Three Chart Types:
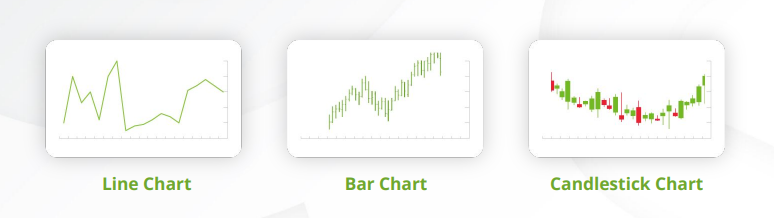
Traders have the flexibility to choose which format is the best.
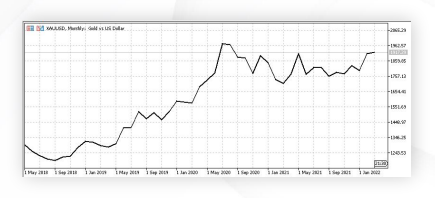
LINE CHART
Line charts are the most basic type of
chart. Technical analysts often use line
charts to easily identify support and
resistance levels.
Line charts only have basic information
plotted on the chart, which means there
is not a lot of other “clutter” to get in the
way of your analysis.
Traders create a line chart by plotting the
closing price of each trading period on a
chart and then connecting each closing
price with a line
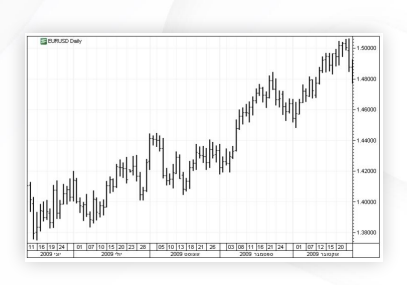
BAR CHART
Bar charts provide more information than
a line chart.
Technical analysts often use bar charts to
know about how a currency pair price
moved up and down during each trading
period.
Whereas line charts only plot the closing
price from each trading period, bar charts
plot the opening, high, low and closing
prices from each period. Each bar
represents one trading period.
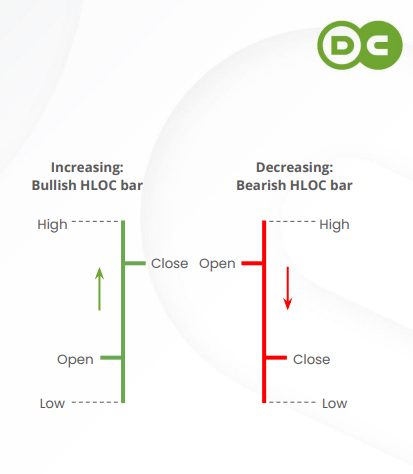
To create a bar, plot the high and low
price of a trading period and connect
them with a vertical line.
Next, plot the opening price out to the
left side of the vertical line and connect
that point to the vertical line with a
horizontal line.
Last, plot the closing price out to the right
side of the vertical line and connect that
point to the vertical line with a horizontal
line.
Seeing where a currency pair started the
trading period compared to where it
ended, it will identify trends.
If the price closes higher than it opened,
investors were bullish on the currency
pair during the trading period.
If the price closes lower than it opened,
investors were bearish on the currency
pair during the trading period.

CANDLESTICK CHARTS
Candlestick charts provide the same
information as bar charts but in a slightly
different format.
Technical analysts often use candlestick
charts instead of bar charts because it is
easier to see and identify various trading
patterns using candlestick charts.
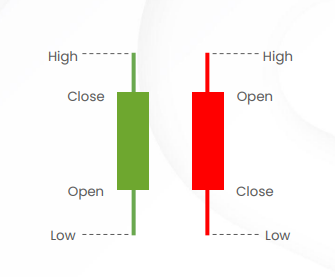
Each candlestick represents one trading
period.
Seeing where a currency pair started the
trading period compared to where it
ended the trading period can help you
better identify trends.
If the price closes higher than it opened,
you know investors were bullish on the
currency pair during the trading period.
If the price closes lower than it opened,
you know investors were bearish on the
currency pair during the trading period.